The Impact of Team Performance - Data to Make Improvements


In the modern workplace, there are a number of factors conspiring against effective teamwork. Information overload, conflicting goals, telecommuting and high staff turnover can make it difficult for highly effective individuals to be a part of truly effective teams.
In fact, over 20 years ago, management great Peter Drucker highlighted the corporate leadership challenge, saying, “Which team to use for what purpose is a crucial, difficult and risky decision that is even harder to unmake.”
It’s a rare executive who does not acknowledge that team performance is a critical aspect of organizational success. Teams drive results by aligning their initiatives with an organization’s strategy.
The ThinkWise Impact of Team Performance Survey collected the thoughts of more than 100 senior executives from organizations across America who shared their experience of building high-performing teams and the overall impact teams have on a company’s success. We asked leaders about the performance realities of their teams, to define the characteristics of high-performing teams and to provide insights into how their teams are in fact performing.
Improving Team Performance
Avoiding accountability is the behavior most likely to be found in underperforming teams, compared to average teams (11 percentage points higher), while not communicating with a leader when unclear is nine percentage points higher in underperforming teams. Blaming others for poor performance is also seven percentage points more likely to exist in underperforming teams.
Traits most likely to be found in underperforming teams
|
Average |
Underperforming |
Difference |
|
|
Avoiding accountability |
53% |
63% |
10 |
|
Not communicating with a leader when unclear on a task |
54% |
63% |
9 |
|
Blaming others for poor performance |
39% |
46% |
7 |
|
Feedback about performance is given a low priority by the boss |
37% |
40% |
3 |
|
Complaining about tasks |
32% |
34% |
2 |
|
Spreading rumors about team members |
36% |
37% |
1 |
|
Ignoring assignment deadlines |
31% |
31% |
0 |
|
Being defensive when feedback does occur |
46% |
46% |
0 |
|
Taking credit when it was a team effort |
17% |
14% |
-3 |
Therefore, it is perhaps unsurprising to see that senior executives with high-performing teams expect internal team performance to have the greatest impact on organizational value (rated 3.42 out of 5 compared to 3.35 average and 3.3 in underperforming teams).
Attributes that will impact organizational value, average rating (out of 5.0)
|
Average |
High Performing |
Underperforming |
|
|
Internal team performance |
3.35 |
3.42 |
3.3 |
|
Availability of human talent |
3.17 |
3.06 |
3.25 |
|
Speed of technological change |
2.88 |
2.91 |
2.86 |
|
Domestic (U.S.) competition |
2.75 |
2.82 |
2.69 |
|
Availability of financial capital |
2.72 |
2.55 |
2.84 |
|
Government regulations |
2.68 |
2.64 |
2.7 |
|
International competition |
1.93 |
2.06 |
1.83 |
Senior executives with underperforming teams rate the availability of human talent second highest (3.25), which likely reflects recognition that to improve team performance, talented people must be recruited to their teams.
The impact of technological change (2.91) and domestic competition (2.82) is realized by business leaders with high-performing teams, but overlooked to a greater degree by executives with underperforming teams.
Respondents with underperforming teams also worry more about the availability of financial capital (2.84) and the impact of government regulations (2.7) compared to leaders of high-performing teams. In contrast, business leaders with high-performing teams are looking at international markets (2.06) and domestic competitors (2.82) and preparing their teams to outperform their rivals.
Senior executives with underperforming teams are more likely to ask for performance training to improve team member effectiveness (four percentage points higher than average and nine percentage points higher than high-performing teams). They are also more likely to ask for increased budget to improve team performance (four percentage points higher than average and eight percentage points more than high-performing teams).
What is needed to be more successful in improving team performance?
|
Average |
High Performing |
Underperforming |
|
|
More effective team members from performance training |
47% |
42% |
51% |
|
More budget |
42% |
38% |
46% |
|
More attention to the measurement process |
39% |
28% |
49% |
|
More measurement data |
30% |
21% |
37% |
|
More executive-level involvement |
23% |
28% |
20% |
|
More performance measurement tools |
23% |
17% |
29% |
|
More trained HR personnel |
19% |
24% |
14% |
|
Better alignment of performance with sales |
19% |
21% |
17% |
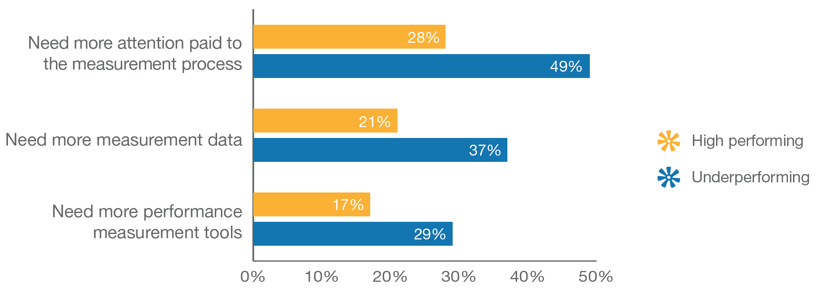
The greatest difference in the ability to improve team performance rests in how they succeed or fail to collect and communicate performance data, as can be seen in the chart below. Almost half (49 percent) of underperforming teams recognize they need to pay more attention to the measurement process, 21 percentage points higher than high-performing peers. Over a third (37 percent) of senior executives with underperforming teams need additional measurement data to be more successful in improving team performance, 16 percentage points higher than peers with high-performing teams. And three in 10 senior executives (29 percent) with underperforming teams seek additional performance measurement tools, 12 percentage points more than peers in high-performing teams.
An inability to measure performance is the
greatest impediment to improving performance

At ThinkWise, our goal is to provide you with the necessary resources to make smart Employee Development decisions. Below is a link to the report: What Gets Measured Gets Managed. This guide will help you understand more about aligning your business strategies and improving team performance.
